Overview
Report Designer
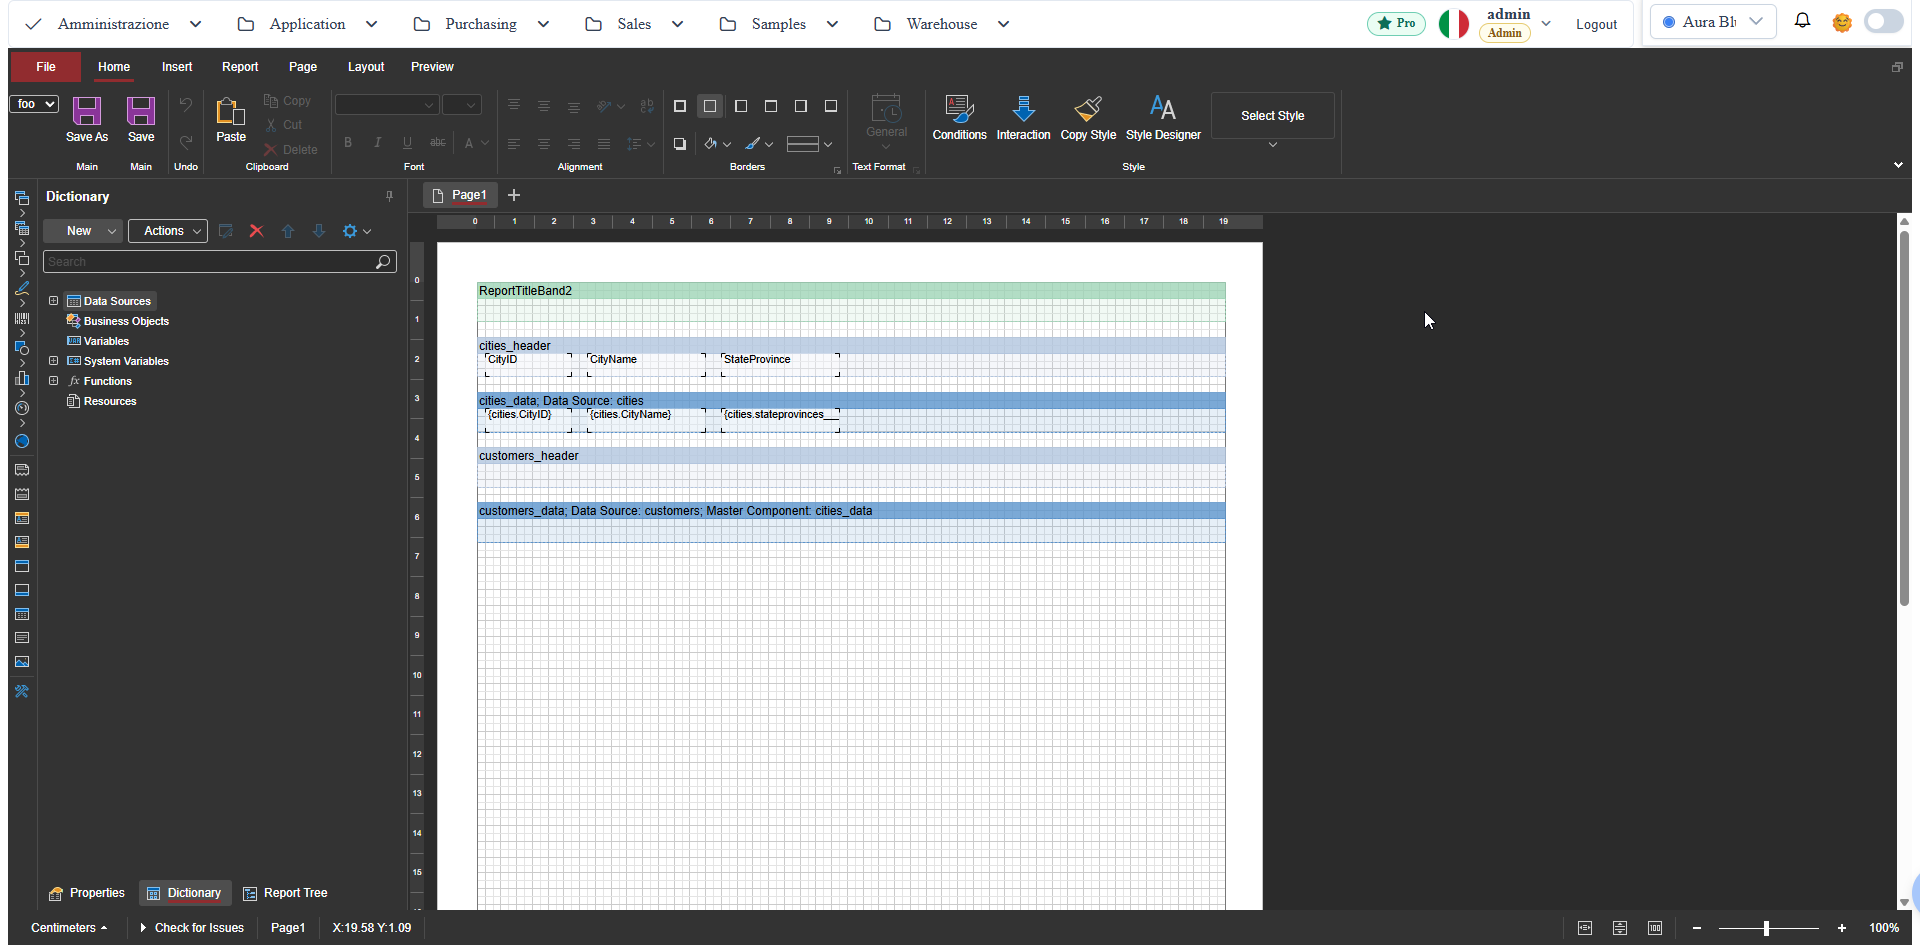
Stimulsoft report designer on route #/<route>/report-designer, integrated with framework metadata.
Screenshot Reference (User Manual)
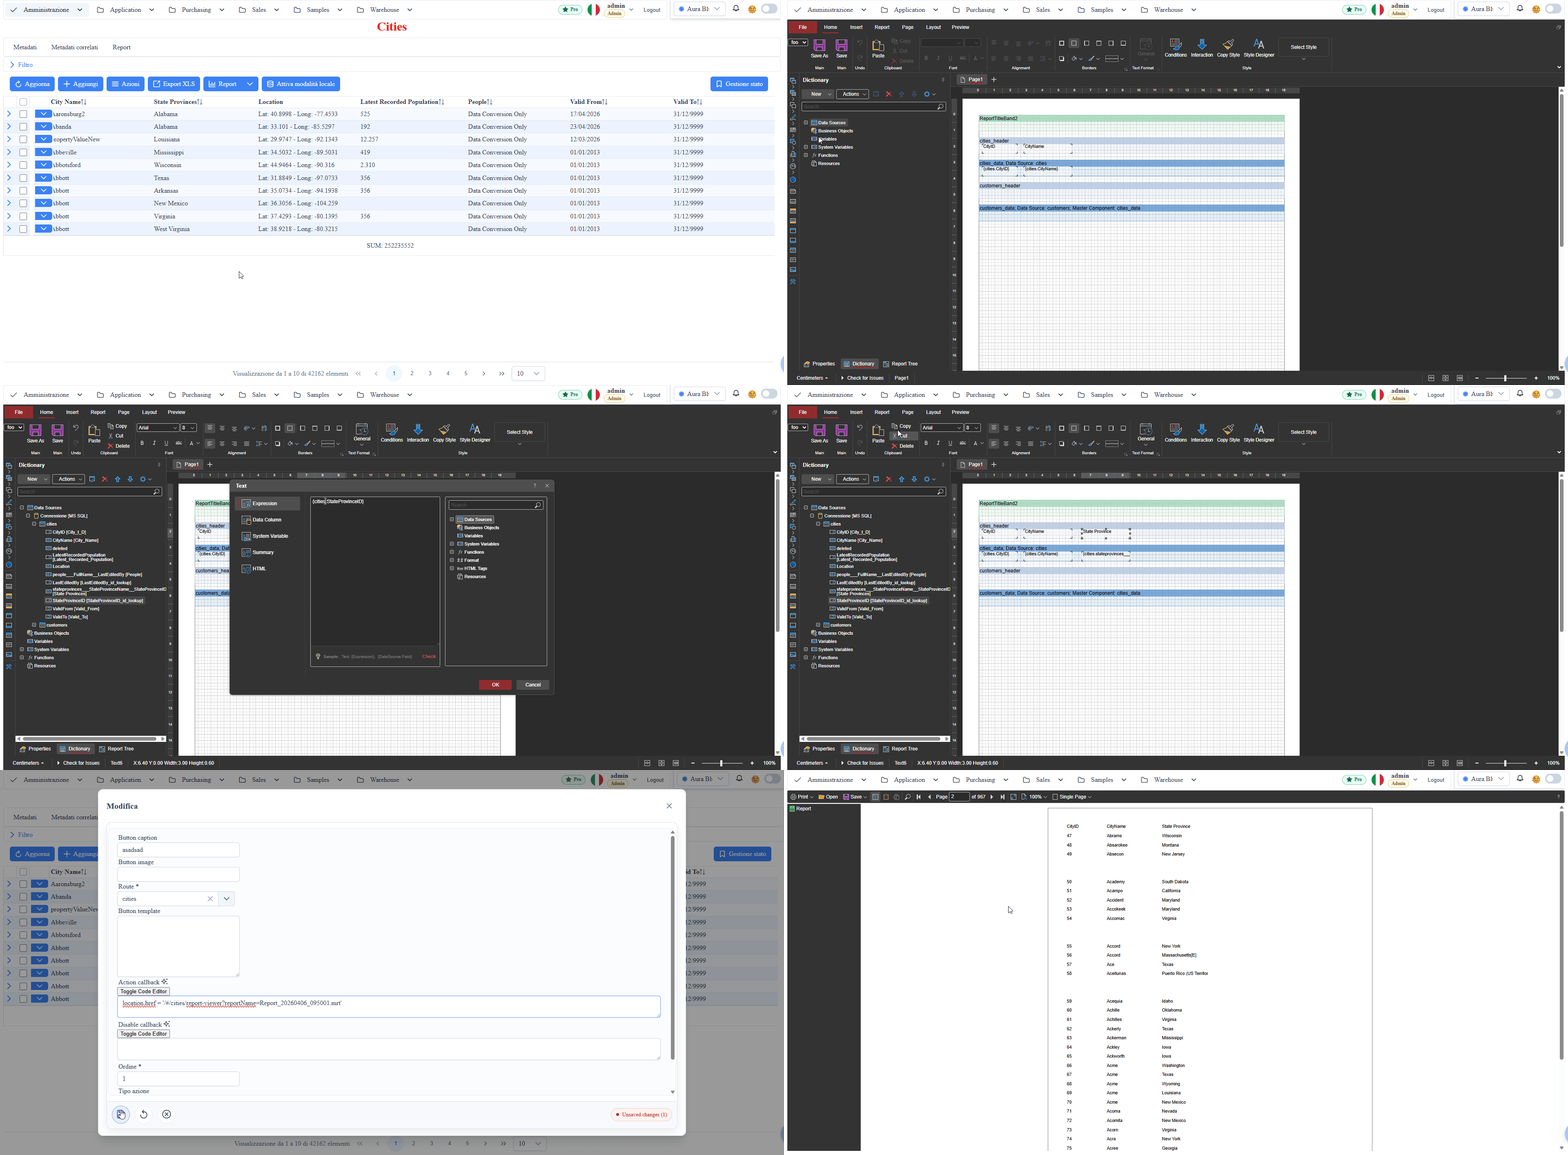
manual__reporting__03.png: report designer opening and main panel structure.manual__reporting__04.png: Stimulsoft datasource example pre-populated from route metadata.
Scope
- Report layout design (
.mrt) directly in the UI. - Report preview and saving associated with the metadata route.
- Support for iterative modification without manual export/import of the data model.
Datasource Pre-population from Metadata
When you open the report designer, the backend prepares the Stimulsoft datasource using the current route's metadata.
Logical flow:
- resolves the metadata route (
_metadati__tabelle) and its related schema/table/query. - reads the column definition (
_metadati__colonne) with names, types, and relevant properties. - builds the Stimulsoft datasource with fields consistent with the application metadata.
- makes the fields available in the designer's Dictionary panel, ready for drag-and-drop into the report.
Result:
- reduced manual field mapping work in the report designer.
- alignment between the data model used in list/grid and the report data model.
- greater robustness when the report is created starting from standard metadata routes.
Guided Creation: Template Selection Dialog
From the list's administrative menubar (Report → Create report) a dialog asks for the template type and the columns to include before opening the designer. The .mrt file is generated and saved server-side (MetaService.scaffoldReport, administrators only) in Reports/<route>/Report_YYYYMMDD_HHMMSS.mrt; the designer then opens on the ready-made file.
Available templates:
- Tabular (bands): row list with headers; cells are already populated with the selected columns (labels in the header,
{route.column}bindings in the data band). Related routes (md_detail_grid_routes/md_nested_grid_routes) are listed as selectable options — unchecked by default — and generate the master-detail bands only when checked, with their own columns. - Pivot table (crosstab): rows × columns matrix with an aggregated value; the dialog asks for one or more row columns, the horizontal dimension column, the value column, and the aggregation function (Sum/Avg/Count/Min/Max).
- Grouped (cross-group): sections per grouping value; the dialog asks for the grouping column, the detail columns, and optional group totals (numeric column + aggregation).
Notes:
- cancelling the dialog creates nothing; for non-administrator users (or on error) the designer opens with the historical empty-bands template.
- unselected columns remain available in the Dictionary panel: the selection only filters the generated cells.
Operational Notes
- If you add/remove metadata columns, reopen the report designer to regenerate the dictionary.
- The report uses metadata-driven field names: avoid uncoordinated renames on the metadata side.
- For advanced scenarios, you can still integrate custom datasources in the
.mrtfile.
Screenshot