Overview
Chart
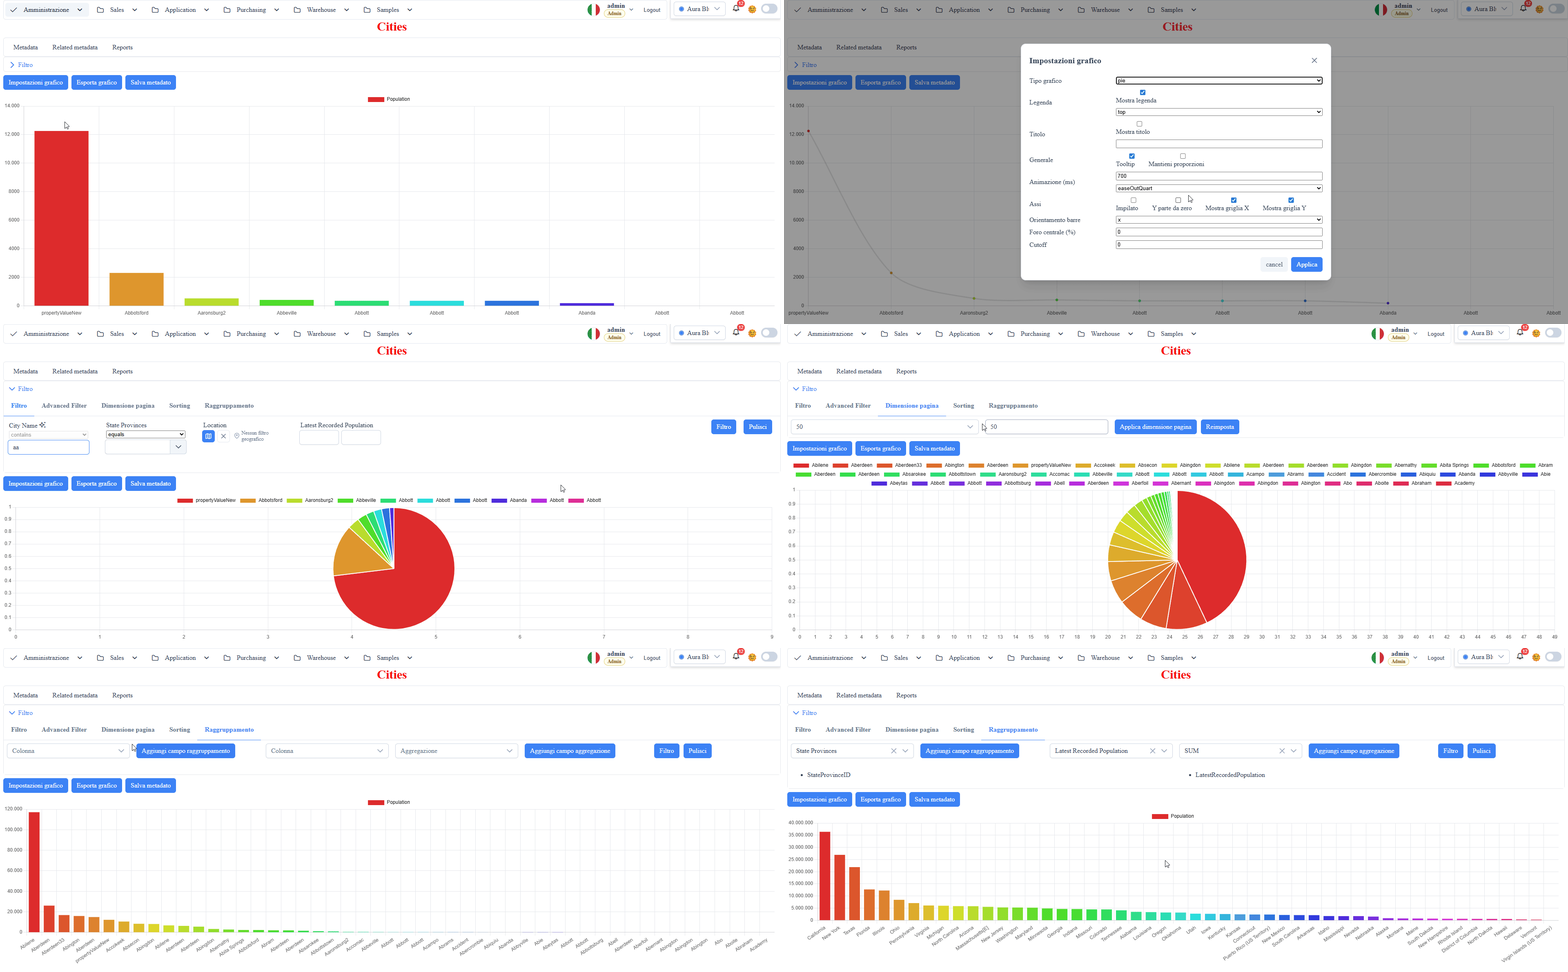
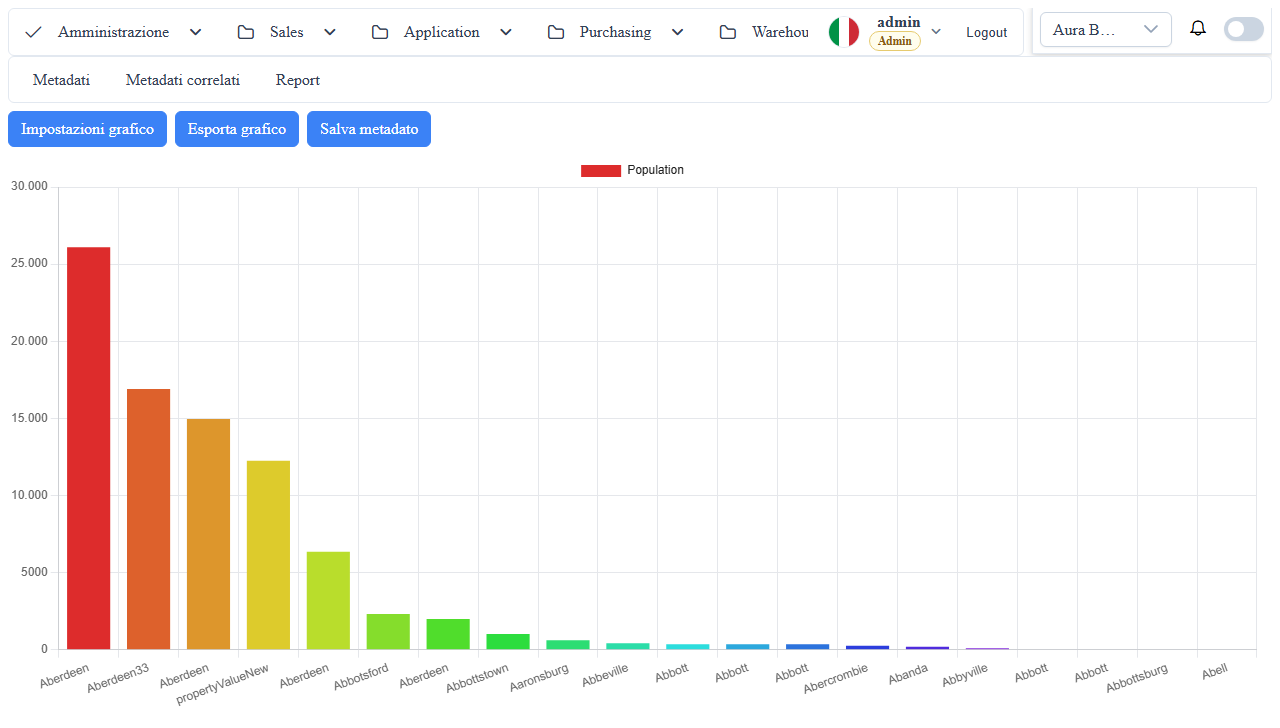
Archetype for aggregated visualization with charts.
When to Use It
- KPIs and analytics
- Temporal or category comparisons
- Operational dashboards
Operational Notes
- Configuration via
archetypes.chart - Supports
dataOptionsand advanced chart engine options
md_props_bag: archetypes.chart
Snippet 1JSON
{
  "archetypes": {
    "chart": {
      "advancedFilter": false,
      "type": "bar",
      "drillDown": "",
      "options": {},
advancedFilter: whentrue, shows thewuic-filter-barfor thechartarchetype (at data-repeater level).type(enum):- supported values:
bar,line,scatter,bubble,pie,doughnut,polarArea,radar drillDown: JS callback or handler for data-point click.options: chart engine options object (runtime pass-through).dataOptions.getChartData: JS callback to build the chart payload.dataOptions.dataPropertyDefault value is 'dato', do not change unless you want to use grouping (advanced filter-bar), in that case use 'Agg' to retrieve the aggregated value from the grouped record:dato: uses the main record-level dataset.Agg: uses the server aggregate block.dataOptions.cutOffCount: top-N cutoff threshold for dataset reduction.dataOptions.datasets[]: multi-series mapping.datasets[].label: static series label.datasets[].labelField: X label/category field.datasets[].dataField: numeric values field.datasets[].backgroundColorField: fill color field.datasets[].generateRandomColor: automatic color if no explicit color is present.datasets[].borderColorField: border color field.datasets[].parseData: JS series transformation callback.
Events and Subscriptions (Host)
Events available on wuic-chart-list:
onChartDataSelect: data-point click relay (p-chart onDataSelect).onChartDrillDown: emitted on drilldown with full payload (event,clickedItem,chartOptions,data).onChartDataBound: emitted when the wrapper completes data binding from the datasource.
Template example:
Snippet 2HTML
<wuic-chart-list
  [hardcodedDatasource]="citiesDs"
  (onChartDataSelect)="handleChartSelect($event)"
  (onChartDrillDown)="handleChartDrillDown($event)"
  (onChartDataBound)="handleChartDataBound($event)">
</wuic-chart-list>
Subscribe example (ViewChild):
Snippet 3ts
@ViewChild(ChartListComponent) chart?: ChartListComponent;
private readonly subs = new Subscription();

ngAfterViewInit(): void {
  if (!this.chart) return;
  this.subs.add(this.chart.onChartDataSelect.subscribe((e) => console.log(e)));
  this.subs.add(this.chart.onChartDrillDown.subscribe((e) => console.log(e)));
Screenshot