Overview
View/Pivot Builder
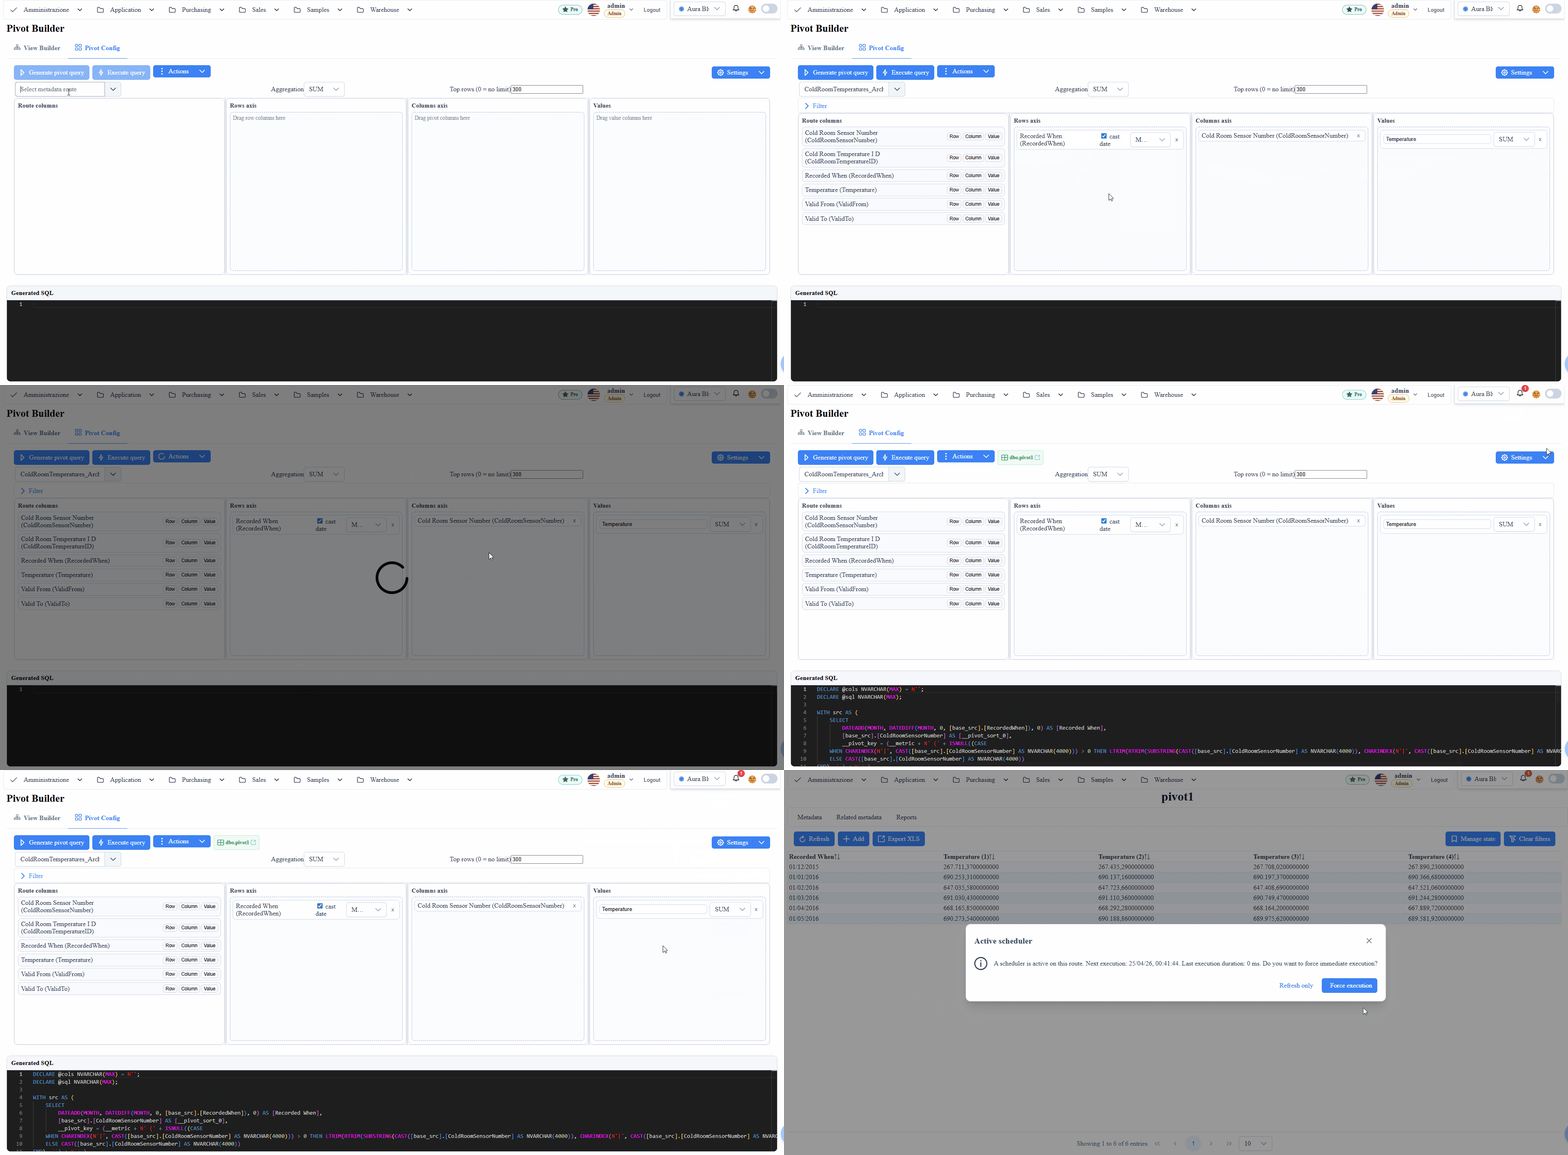
The Pivot Builder allows you to build dynamic analytical views starting from metadata routes, without writing manual queries on the UI side.
Screenshot Reference
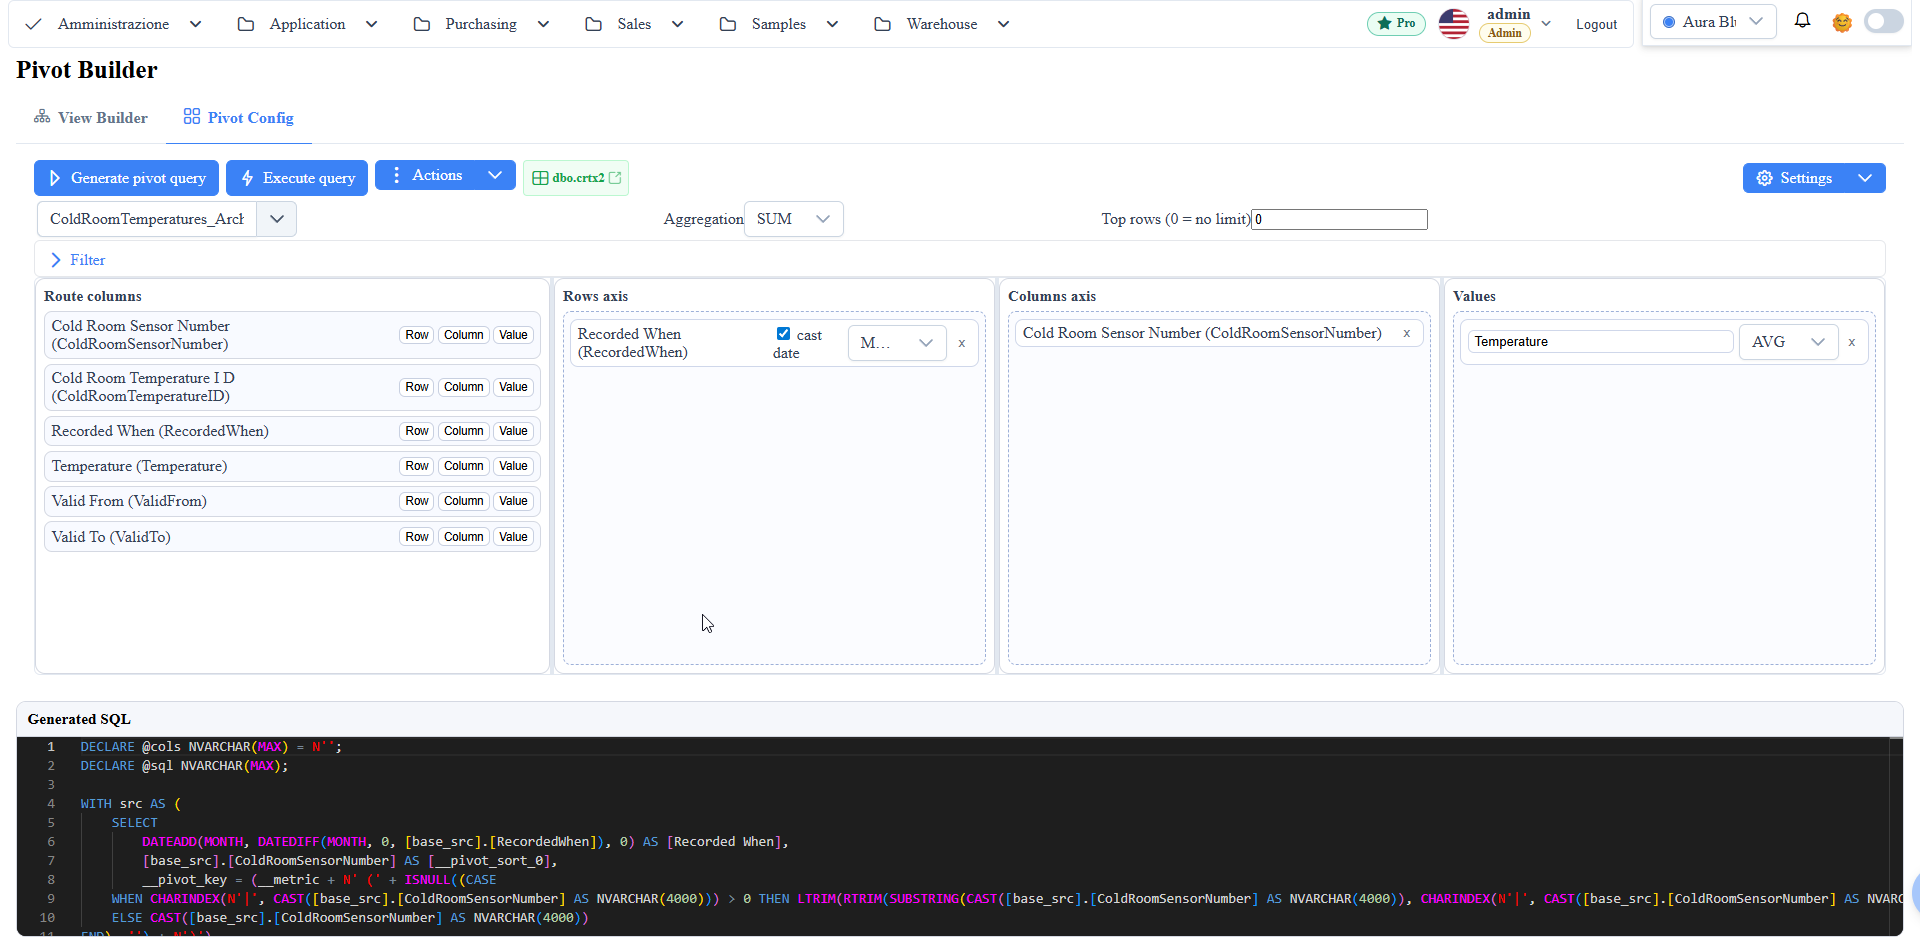
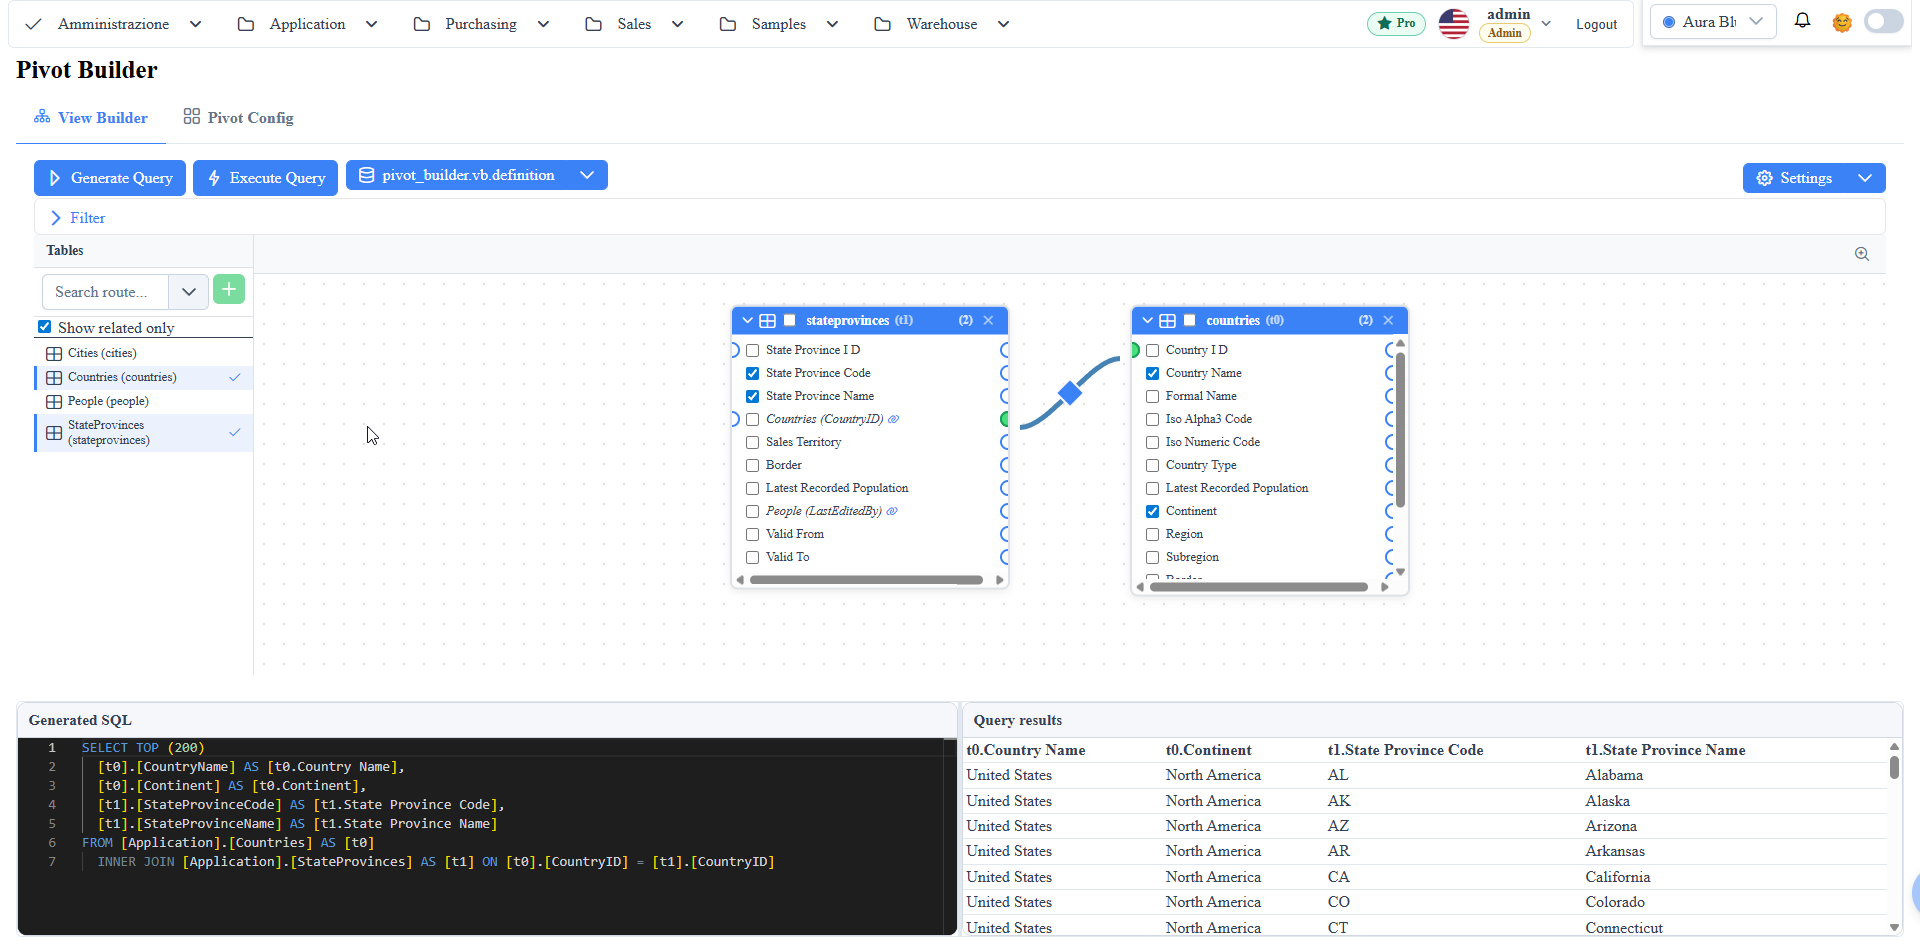
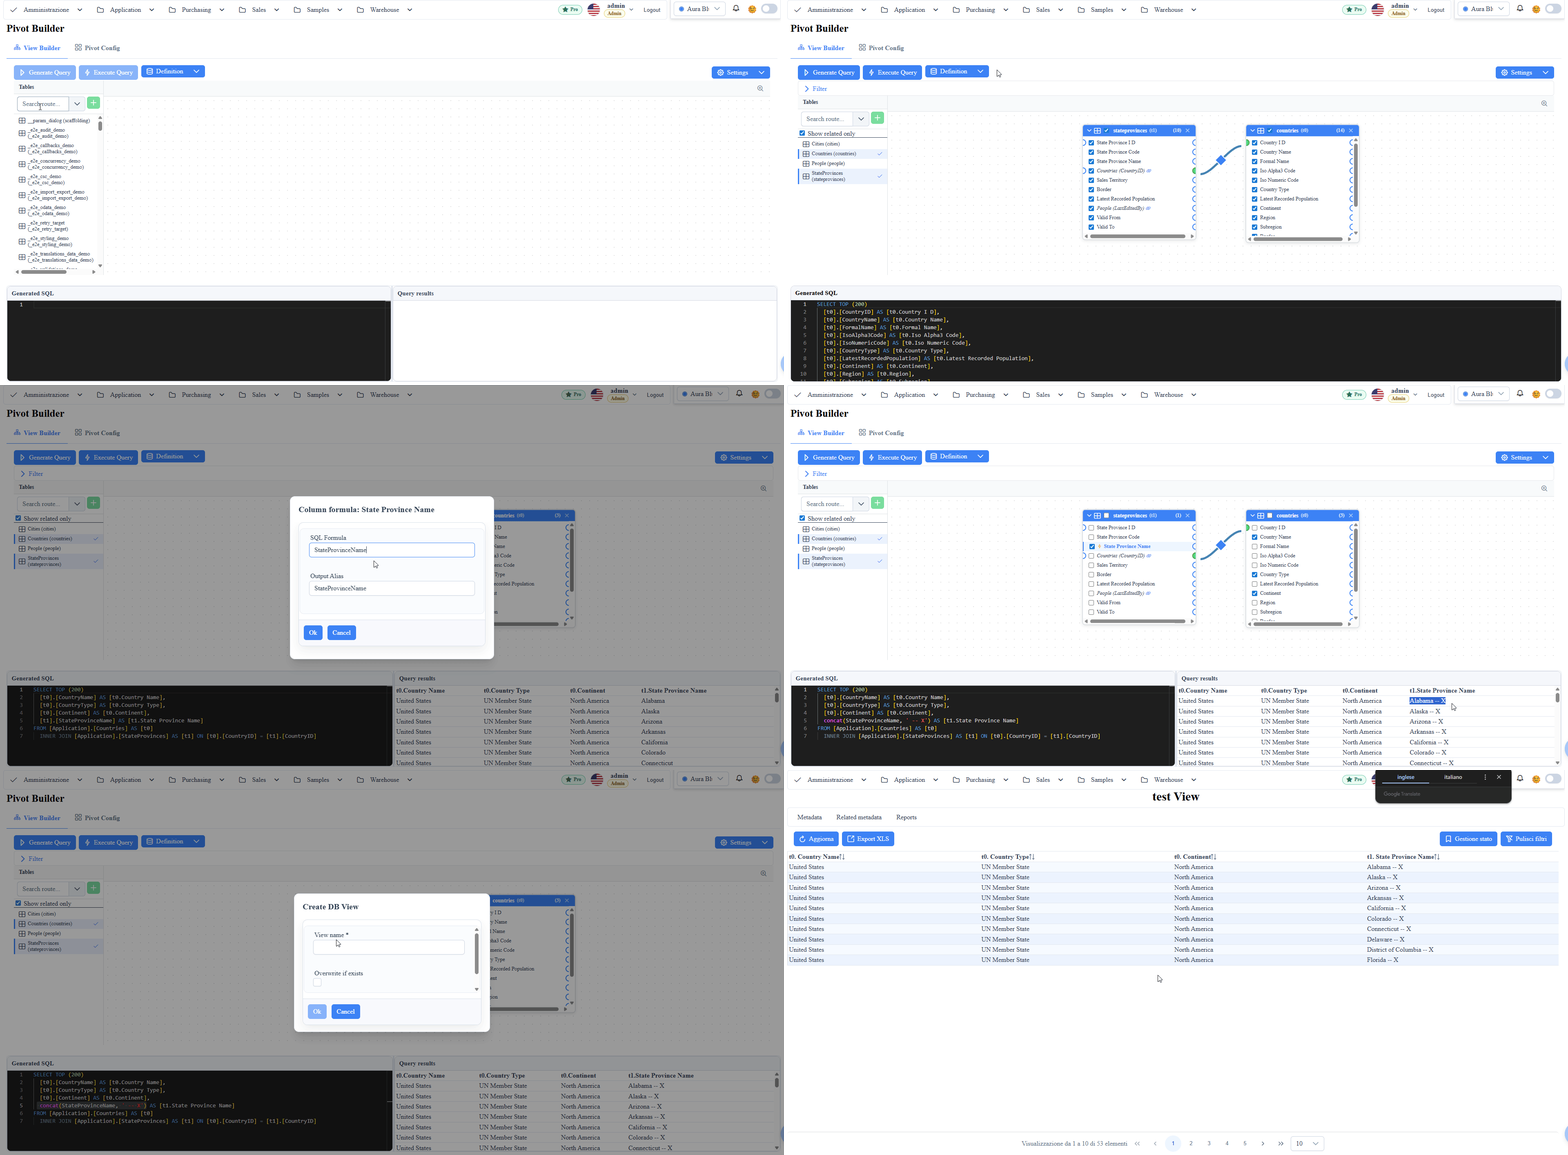
manual__pivot_builder__01.png: builder configuration and runtime result.manual__pivot_builder__02.png: materialized table creation dialog detail and operational options.
Main Features
- Field selection in
rows,columns, andvaluesareas. - Available aggregations on values (sum, count, average, minimum, maximum).
- Multidimensional grouping with sorting by dimension.
- Interactive filters to reduce the analyzed dataset.
- Real-time pivot view update after layout or metric change.
- Export/reuse of the pivot configuration in the operational context.
View Builder Tab — Aggregations and GROUP BY (Tier 1, 2026-05-08)
Tab 1 "View Builder" now lets you emit GROUP BY with SUM/COUNT/AVG/MIN/MAX/COUNT(DISTINCT) aggregations directly from the ViewDefinition, without falling back to manualSql mode.
Panel below the canvas:
- Aggregations: form to add
function(column) AS alias. The source column can be any column on the canvas or*(forCOUNT(*)); the output alias is auto-generated when blank. - GROUP BY: checkbox per selected column on canvas nodes. If none is explicitly checked, the backend infers dimensions from the
selected=truenon-aggregated columns. - CASE WHEN for pivoting: for patterns like
SUM(CASE WHEN bucket='X' THEN amount ELSE 0 END)use a formula column (right-click → Edit formula) as aggregation source. The formula is emitted as the aggregate argument.
Backend output (MetaService.previewViewDefinition):
viewDefinition.aggregations[]→ emits<FN>(<col|formula>) AS <alias>as additional SELECT columnsviewDefinition.groupByColumns[]→ emitsGROUP BYclause- Auto-infers GROUP BY when
aggregationsare present without an explicitgroupByColumns
UNION blocks (Tier 2, 2026-05-08)
A subsequent extension lets you concatenate multiple SELECTs with UNION or UNION ALL directly from a single ViewDefinition:
- Block 0 = top-level (canvas tables/joins/aggregations) → defines the canonical vocabulary of SELECT columns
- Block N (N≥1) = each additional
unionBlocks[]is a single-table sub-definition with a requiredcolumnMapping: for every canonical alias of block 0, block N specifiessourceQualified(column from the block) orconstantValue(SQL literal like'CLIENT') orformula(SQL expression for cross-block cast) - UNION ALL / UNION toggle: default
unionAll: true(no dedup, better performance);falseforUNION DISTINCT - TOP/LIMIT: applied to the whole UNION, wrapped in subquery
SELECT TOP N * FROM (<union>) AS u
UI below the canvas: route picker + "Add UNION block" button → each block shows as an accordion with header (caption + route) + column-mapping matrix (per canonical alias: dropdown of block source col, or constant SQL input).
v0 limits: each UNION block is single-table (no JOIN within block). For cross-block JOIN (e.g. 'BOTH' category in vw_anagrafica_unificata that requires clients INNER JOIN suppliers ON vat) Tier 2.5 is needed.
Recommended Operational Flow
1. Open the pivot builder route.
2. Select the starting datasource/metadata route.
3. Drag fields into the rows, columns, values zones.
4. Configure the aggregation for each metric.
5. Apply filters and verify the totals.
6. Save or reuse the configuration according to the application flow.
Action Buttons
Create view
- Generates a SQL view from the current pivot configuration.
- Useful when you want to reuse the result as a stable data source in other routes/reports.
- Keeps the logic centralized in the DB, avoiding manual layout reconstruction each time.
Create materialized table
- Creates a physical table with the aggregated data from the pivot configuration.
- Useful for large datasets or dashboards where fast read times are needed.
- Automatically scaffolds the route associated with the created physical table and generates a schedule for data refresh/alignment.
- Pressing Refresh on the grid in the associated route forces a schedule run.
Usage Notes
- For consistent analysis, use columns with the correct data type (numeric for metrics, text/dates for dimensions).
- When dealing with large volumes, prefer targeted filters and aggregations before expanding the detail.
Screenshot