Overview
Chart
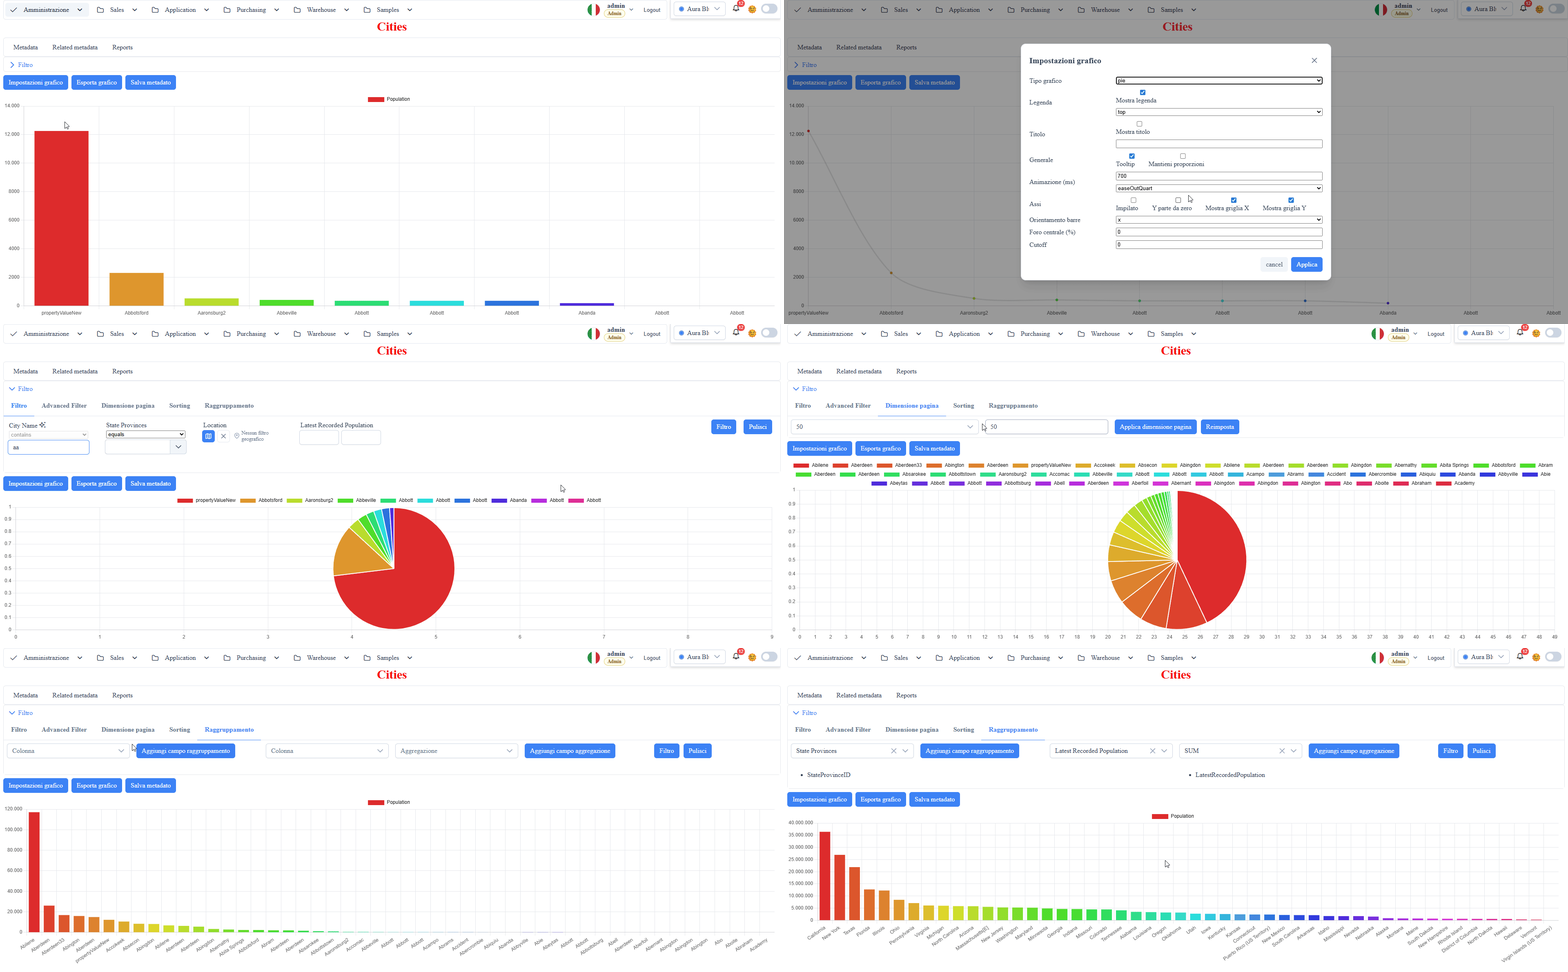
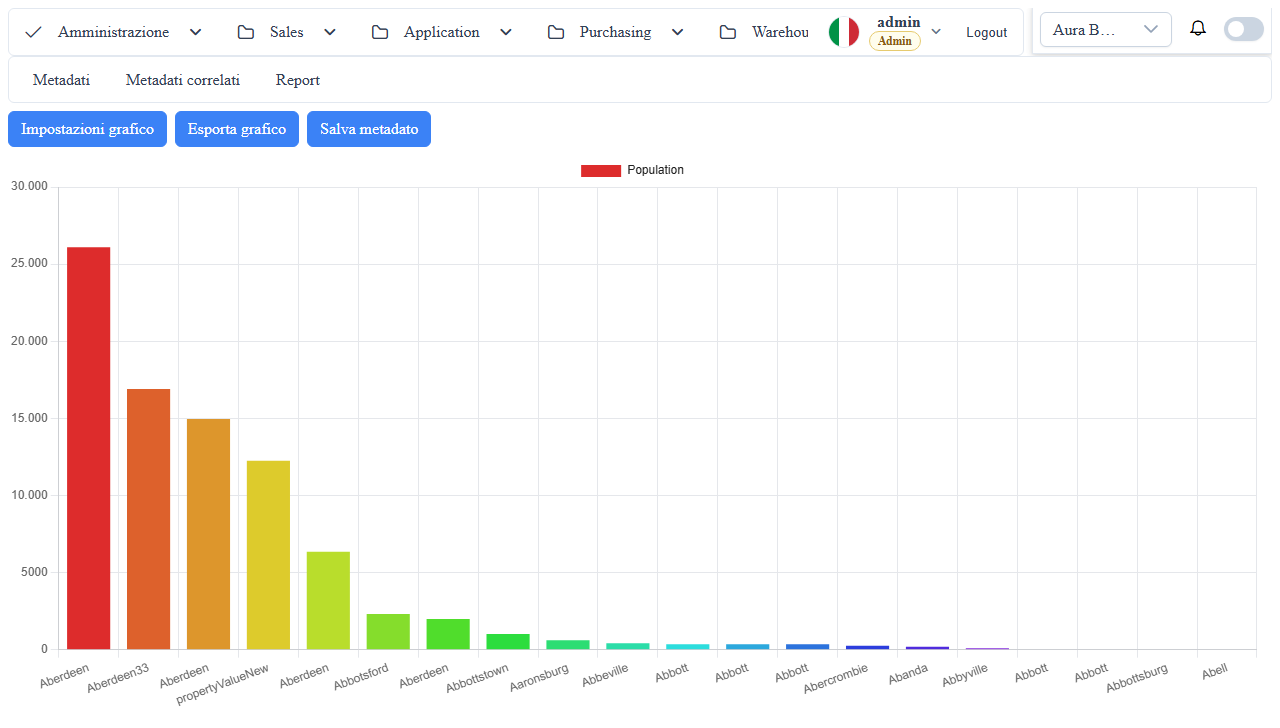
Archetype per visualizzazione aggregata con grafici.
Quando usarlo
- KPI e analytics
- Confronti temporali o per categoria
- Dashboard operative
Note operative
- Configurazione tramite
archetypes.chart - Supporta
dataOptionse opzioni avanzate del chart engine
md_props_bag: archetypes.chart
Snippet 1JSON
{
  "archetypes": {
    "chart": {
      "advancedFilter": false,
      "type": "bar",
      "drillDown": "",
      "options": {},
advancedFilter: quandotruemostra lawuic-filter-barper l'archetypechart(a livello data-repeater).type(enum):- valori supportati:
bar,line,scatter,bubble,pie,doughnut,polarArea,radar drillDown: callback JS o handler per click sul data-point.options: oggetto opzioni engine chart (pass-through runtime).dataOptions.getChartData: callback JS per costruire il payload chart.dataOptions.dataPropertyValore predefinito è 'dato' non modificare a meno di non voler utilizzare il raggruppamento (advanced filter-bar) in quel caso usare 'Agg' per recuperare il valore aggregato dal record raggruppato:dato: usa il dataset principale record-level.Agg: usa il blocco aggregati server.dataOptions.cutOffCount: soglia taglio top-N per riduzione dataset.dataOptions.datasets[]: mapping multi-serie.datasets[].label: label statica serie.datasets[].labelField: campo label X/categoria.datasets[].dataField: campo numerico valori.datasets[].backgroundColorField: campo colore fill.datasets[].generateRandomColor: colore automatico se non presente colore esplicito.datasets[].borderColorField: campo colore bordo.datasets[].parseData: callback JS trasformazione serie.
Eventi e subscriptions (host)
Eventi disponibili su wuic-chart-list:
onChartDataSelect: relay click data-point (p-chart onDataSelect).onChartDrillDown: emesso su drilldown con payload completo (event,clickedItem,chartOptions,data).onChartDataBound: emesso quando il wrapper completa il binding dati dal datasource.
Esempio template:
Snippet 2HTML
<wuic-chart-list
  [hardcodedDatasource]="citiesDs"
  (onChartDataSelect)="handleChartSelect($event)"
  (onChartDrillDown)="handleChartDrillDown($event)"
  (onChartDataBound)="handleChartDataBound($event)">
</wuic-chart-list>
Esempio subscribe (ViewChild):
Snippet 3ts
@ViewChild(ChartListComponent) chart?: ChartListComponent;
private readonly subs = new Subscription();

ngAfterViewInit(): void {
  if (!this.chart) return;
  this.subs.add(this.chart.onChartDataSelect.subscribe((e) => console.log(e)));
  this.subs.add(this.chart.onChartDrillDown.subscribe((e) => console.log(e)));
Screenshot